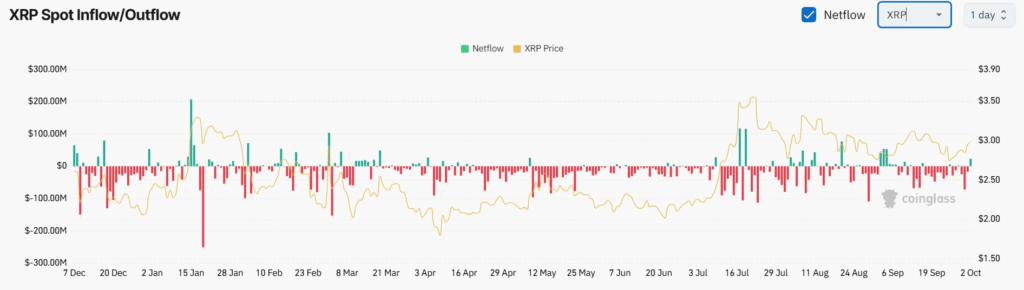
XRP has consistently remained one of the most actively traded cryptocurrencies in the market, but its inflow and outflow data reveal a fascinating picture of volatility and investor sentiment. The latest Coinglass XRP Spot Inflow/Outflow chart highlights significant fluctuations in liquidity movements, suggesting that traders are actively rotating capital in and out of the asset. When combined with XRP’s price performance, the data shows how closely investor behaviour ties to market conditions and sentiment.
Netflow Dynamics: Outflows Dominate
The chart clearly indicates that outflows dominate inflows across most of the observed timeframe. Red bars, representing outflows, are consistently larger and more frequent than green bars, which denote inflows. Large outflow spikes, sometimes exceeding $200 million, point toward periods where traders moved substantial capital out of spot markets.
These consistent outflows suggest that many investors chose to realize profits or reduce exposure during periods of uncertainty. For example, between February and May, XRP experienced persistent negative netflows, showing sustained selling pressure that correlated with a dip in its price trajectory.
Inflow Spikes Reflect Opportunistic Buying
Despite dominant outflows, inflows are not absent. Occasional green spikes, some surpassing $100 million, reveal moments of strong buying interest. Notably, inflows occurred around mid-January and again in July, coinciding with XRP price rebounds.
These inflows likely represent opportunistic buying, where traders took advantage of dips or anticipated bullish price moves. The mid-January inflow aligns with a sharp price rise above $3.00, while July’s inflows came before a rally that pushed XRP to a local high near $3.80. Such patterns demonstrate that while bearish sentiment often drives outflows, inflows can quickly return when market participants see upside potential.
Related article: Altcoin Showdown: Can ETH and XRP Close the Gap as Bitcoin Dominance Hits 58%?
Price Movements Mirror Netflow Trends
The yellow line, representing XRP’s price, reflects a clear connection between netflow behaviour and price action. Sustained outflows frequently coincide with price declines, while sudden inflow spikes often precede rallies.
For instance, in April and May, as XRP prices slipped closer to the $2.00 level, netflows turned sharply negative. Conversely, July saw strong inflows accompanied by a rapid surge above $3.50. Most recently, in September and early October, despite dominant outflows, XRP’s price stabilized around $2.70–$3.00, showing resilience even with persistent capital flight.
What This Means for XRP’s Market Outlook
The netflow analysis shows a market driven by short-term sentiment swings. While dominant outflows highlight ongoing caution, the recurring inflow spikes prove that buyers remain eager to accumulate during favourable conditions. This push-and-pull dynamic reflects XRP’s broader position in the market, as a cryptocurrency influenced by both speculative trading and long-term adoption narratives.
Moving forward, sustained inflows would be required to establish a stronger bullish trend. If XRP continues to experience consistent outflows, downside risks could reemerge despite its relative price resilience. However, as the data reveals, opportunistic inflows are never far behind, keeping XRP highly reactive to shifts in investor sentiment and external catalysts.
For now, XRP’s outlook depends on whether inflows can build momentum and counteract persistent outflows. If inflows strengthen, the price may find support above $3.00; if not, selling pressure could push XRP back toward $2.50.